Before the pandemic, charts featuring sharp spikes and cliffs were always based on financial market data. Covid-19 means that previously slow things now move fast, with rapid shifts in the labour market and rising inequality across sectors and regions.
Newsletter from 4 December 2020
Covid-19 really is changing everything. It was once a useful rule of thumb to separate out ‘jump’ and ‘crawl’ variables in economics. Anything financial – like stock prices or the exchange rate – can change value almost instantly, so that when plotted against time, the charts jump around with sharp spikes and dips. Things related to the ‘real economy’ – like employment or consumption – are slower moving, so that charting them over time normally produces smoother mountains and troughs as the economy evolves. This slower pace is because human decisions – to hire or fire, to spend or save – take time.
This was in the pre-Covid-19 world. Post-pandemic, slow-moving things have sped up, as an Economics Observatory piece by Jack Blundell and Maria Ventura on the extraordinary shifts in self-employment made clear this week.
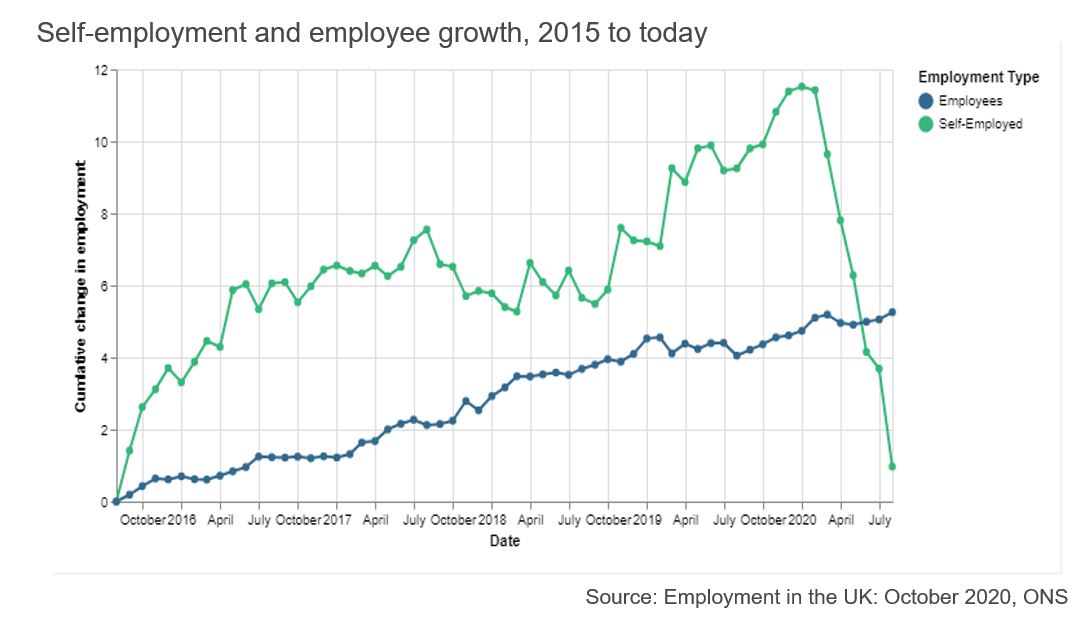
They first set the background: there had been a sizeable, but crawling, increase in self-employment in the UK between 2015 and the end of 2019 – an increase of around 12% (see Figure 1). Yet since the onset of the pandemic, there has been a sudden reversal, with the chart of self-employment looking more like a tanking financial ‘jump’ variable than a measure of livelihoods.
Coming up with sound policies to support the self-employed has been hard, as the authors explain. The group is diverse and includes many that work in the hardest hit industries – in-person customer services, hotels, restaurants and the arts. The first-hand economic experience of people working in these sectors – at the epicentre of the Covid-19 shock – were discussed in this account we posted recently. The government’s response was a support scheme – the Self-Employment Income Support Scheme (SEISS) – which paid self-employed workers based on records of their past incomes.
The policy helped at an economy-wide level, with aggregate income fluctuations almost perfectly smoothed out by the scheme. Yet this masks huge differences at the individual level: some self-employed workers have suffered large income losses or are ineligible for help; at the other end of the scale, HM Revenue and Customs has confirmed that some claimants received large and unjustified amounts, and suggested that voluntary repayments be made. These pieces are a timely reminder that pandemic-related economic policies are blunt tools made on the fly. The Covid-19 time warp inevitably creates winners and losers.
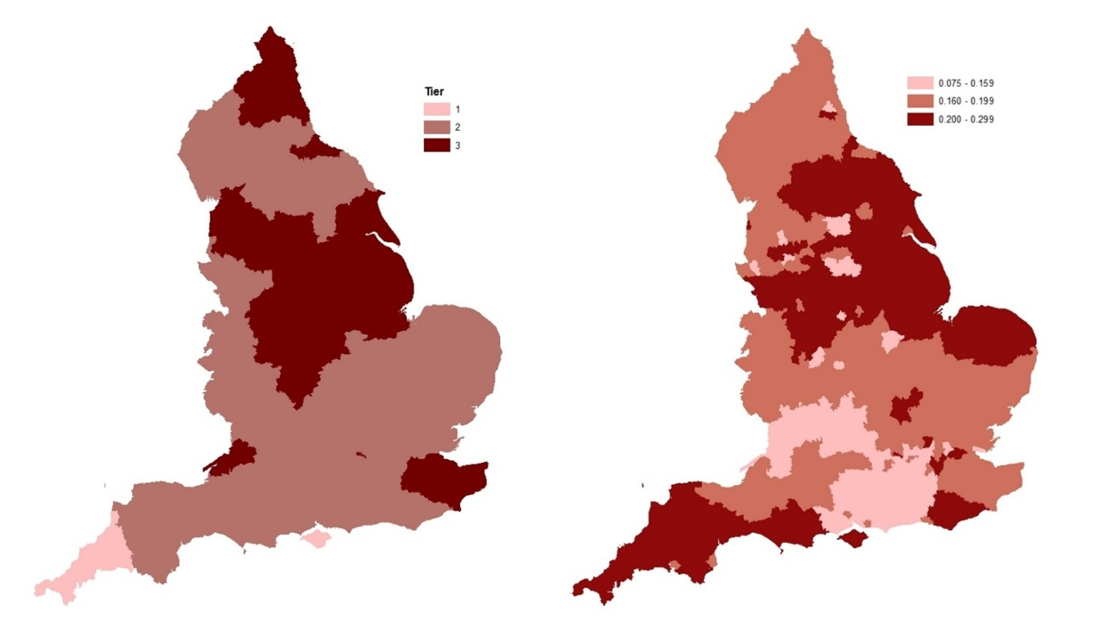
A data piece based on two maps, put together by Helen Simpson at the University of Bristol’s Centre for Evidence-based Public Services, also looked at employment patterns this week. The first shows the new tiers in England, with Tier 3 areas in the darkest shade. The second uses Office for National Statistics (ONS) data to show the share of employment in the most locked-down sectors (retail, distribution, and food and accommodation).
In the South of England, there is little overlap: Cornwall, for example, is in Tier 1, but has a high share of workers in these vulnerable sectors. The North is more concerning, with a large region that is both in Tier 3 and has a high share of workers vulnerable to the stricter lockdown measures.
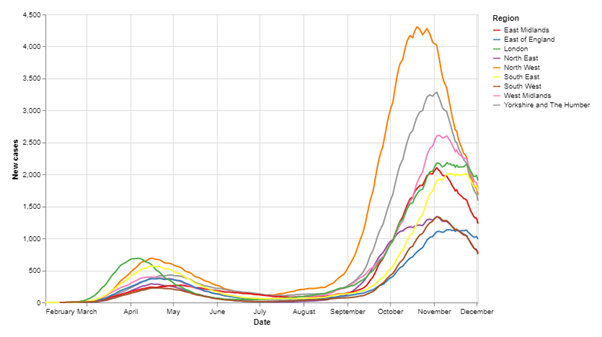
This is another example of Covid-19 inequality, this time regional. The figure below uses UK government data to show how one measure – cases – has diverged across regions. The Observatory will continue to assess the crisis at both a national and regional level. Do check out our recent pieces on Wales, Northern Ireland and Scotland.
Observatory news
We are finally official! We are grateful to the Economic and Social Research Council (ESRC), who have announced support for the Observatory, allowing us to continue until 2022. Our new website, coming in January, will include a piece on the founding of the Observatory and we are particularly grateful to Rachel Griffith of the University of Manchester and the Institute for Fiscal Studies, who spearheaded the project and remains a lead editor, guiding what we do and providing lots of ideas that keep the site fresh and relevant.
Next, a useful (we hope) offer. In January, Romesh and I will be running the first of our masterclasses on writing economics for public consumption. We are putting together a guide of tips and tricks we have both picked up over the years and will give participants in-depth feedback on writing samples. The group size will be small (up to six) and the first one is aimed at PhD candidates. If you would like to improve your writing, get in touch via [email protected].
Finally, an important shift in the way we work. In last week’s newsletter, Romesh commented on the report authored by Johnny Runge and Nathan Hudson at the Economics Statistics Centre of Excellence (ESCoE) and ONS. Having had time to mull it over, I think it is devastating for anyone working in economics. The report is a monster – 235 pages – and for me comes down to two things: a shortfall in public understanding of economics; and a lack of trust in the data we use.
Over time, we hope the Economics Observatory can contribute to the fight back on the first problem through our writing, masterclasses and events. On data, we are acting now. From January, all charts posted on our website will be built using embedded data (rather than static pictures), so that anyone can download, verify and challenge them. The charts in this newsletter are drawn in Vega-Lite and are on GitHub, here. If you are interested in data visualisation, come and work with us.


