The recent volatility of financial markets and the monetary policy response to the Covid-19 crisis have led to renewed concerns about the funding of occupational pensions. The impact will be felt by scheme sponsors and members – and in the viability of the Pension Protection Fund.
Occupational pension provision in the UK has been in a state of flux over the past two decades, and this has been intensified by the fallout from the Covid-19 pandemic. It is estimated that around 45 million people in the UK are members of occupational schemes (Office for National Statistics, ONS, 2019). Of these schemes, 62% are ‘defined benefit’ (DB) in nature and the remaining 38% are ‘defined contribution’ (DC).
Defined benefit versus defined contribution
In a DB scheme, the benefits are defined ex-ante and are generally a function of the member’s final (or average) salary, pensionable service and a pre-set benefit accrual rate. Employers and members contribute to a pension fund, which is invested (primarily in public market securities) and used to satisfy benefit obligations as they come due. Any projected deficit in scheme funding is the responsibility of the pension sponsor (the employer) and appears on corporate balance sheets as a debt-like equivalent.
In contrast, in a DC scheme, the contribution rates of scheme members and employers (if any) are defined ex-ante, but the member benefit is not. There is no balance sheet recognition, but contributions are expensed as they are paid. Consequently, the risk of investment underperformance in a DB scheme is borne by the employer, whereas in a DC scheme it is borne by scheme members.
Asset allocation in DB versus DC schemes
DB schemes pool the contributions of all members and the sponsor for investment, primarily in listed equities and bonds. But the relative importance of these asset classes has changed over time with schemes allocating more heavily to fixed income in an attempt to reduce asset volatility.
In 2003, around 67% of DB assets of FTSE 350 schemes were invested in equities. This had declined to around 20% by the end of 2019 (see Figure 1). Allocations to bonds are up from around 28% in 2003 to 60% in 2019. In more recent years, schemes have increasingly allocated towards alternative investments in a search for both yield and diversification: these now make up around 20% of DB assets.
Figure 1: Pension asset weighted asset allocation of FTSE 350 DB schemes
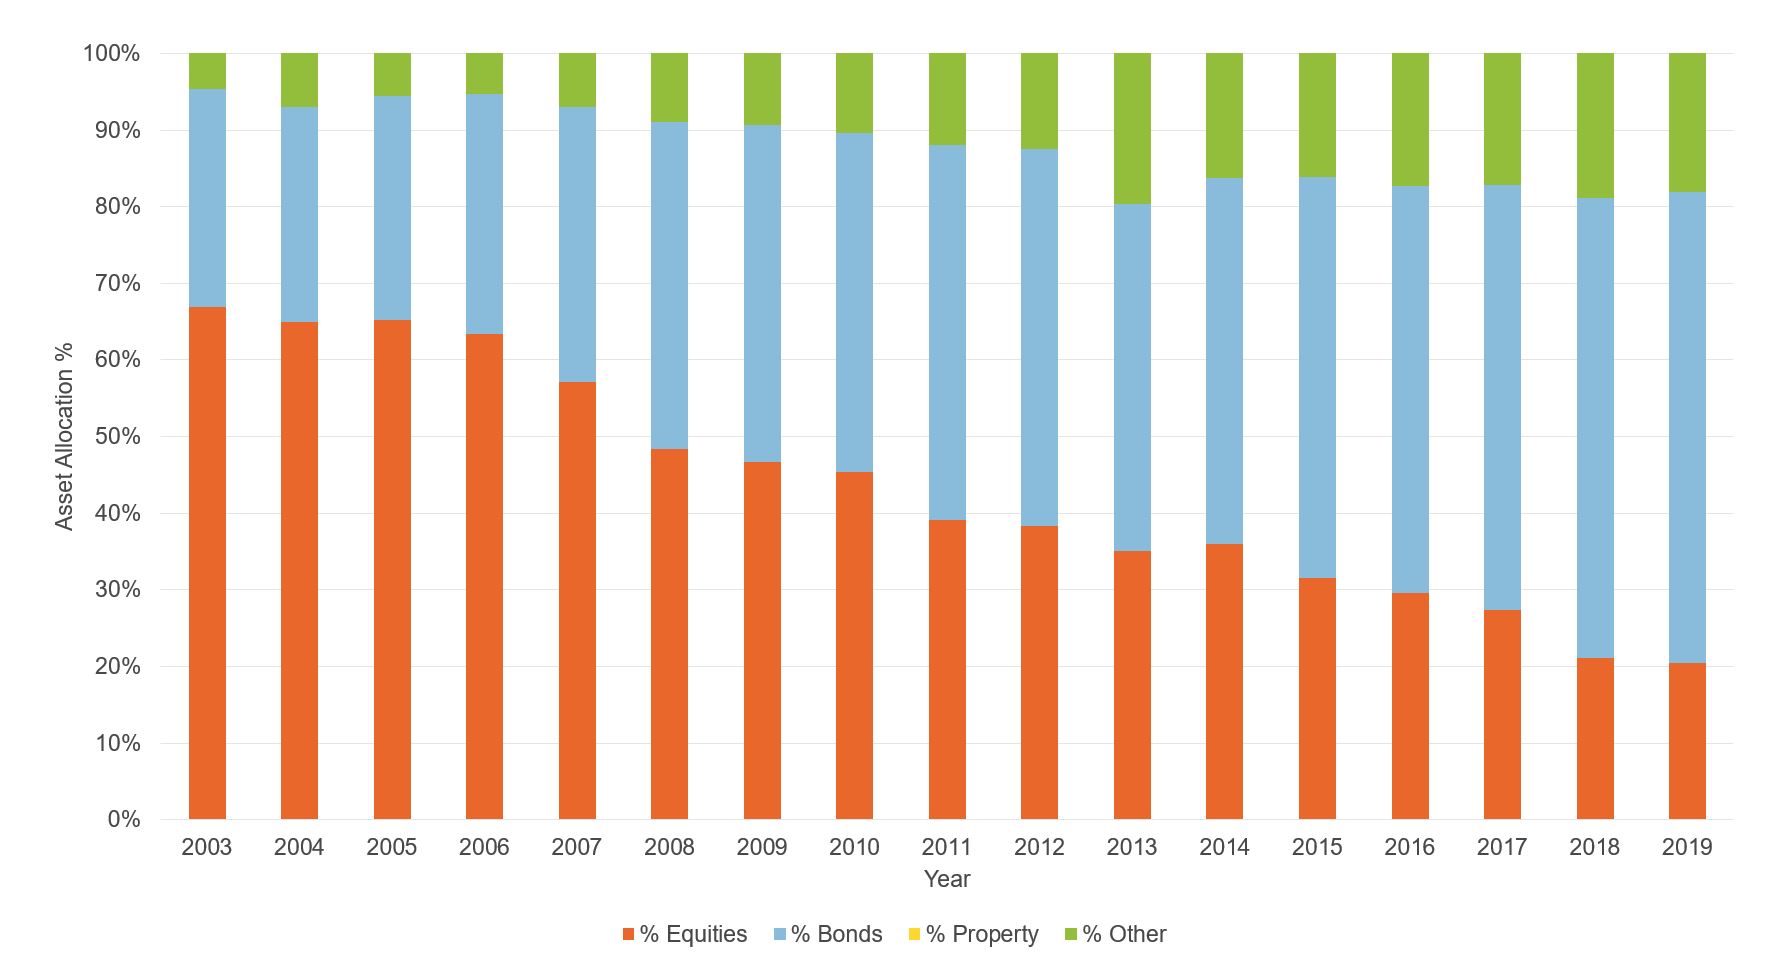
Source: Datastream and author’s calculations
As of 2019, the year-end total equity exposure of UK schemes was split around 17%:70%:13% between domestic, overseas and private equity. The total bond exposure was split around 25%:28%:47% between fixed rate government bonds, fixed rate corporate bonds and index-linked securities (PPF Purple Book, 2019).
DC schemes use individual investment pots and the asset allocation in default funds varies with projected term until retirement. For members who are 30 years from retirement, the average default DC allocation to equities for FTSE 350 firms is around 56%, with around 11% in bonds and around 26% in multi-asset products (which themselves tend to have significant equity exposure). For members who are 10 years from retirement, equity allocation is around 34%, with around 14% in bonds and 28% in multi-asset products (Willis Towers Watson, 2020). Therefore, the average member of a DC scheme has greater exposure to equity markets than the average member of a DB scheme.
DB scheme valuation
There are two primary methods used to value DB schemes. The first is for accounting purposes and is governed by International Accounting Standard 19 (IAS19). It values the scheme yearly at fiscal year-end. DB deficits are an on-balance sheet liability. Thus, it affects investor and creditor perceptions of corporate gearing and the adherence to liability related covenants. The IAS19 valuation also affects the pension expense and thus corporate earnings.
The second valuation method is for actuarial funding and regulatory purposes and takes place at least triennially. The actuarial valuation is used by the Pensions Regulator to examine the strength of the scheme and by the company to determine the cash contribution schedule.
DB pension assets are marked to market and primarily invested in listed equities and bonds. The valuation of DB scheme liabilities is complex and is a function of a series of demographic assumptions (for example, member longevity), economic assumptions (for example, long-run salary inflation, discount rates) and scheme-specific assumptions (for example, early retirement rates, death in service). Market volatility and variability in the valuation assumptions manifest in volatile funding estimates.
Market reaction to Covid-19
DB schemes have faced several valuation headwinds in the current year to date. Between the end of 2019 and mid-March 2020, leading stock indices in both developed and emerging markets had lost over 30% of their value as the pandemic intensified in Europe. Since then, there has been recovery in equity markets, but the FTSE All Share and Stoxx Europe 600 remain 20% and 11% respectively off their 2019 year-end values.
IAS19 requires all schemes to discount pension liabilities at the yield on high quality (AA rated) corporate bonds. Actuarial valuations allow a more scheme-specific approach taking into account the risk of pension assets. But most actuarial valuations used a ‘gilts plus margin’ method with the yield on long-term gilts as its anchor.
As Covid-19-related market stress intensified in March, the sell-off in gilts and corporate bonds caused a significant jump in discount rates, which under prescribed valuation methods reduced the present value of DB liabilities significantly. The Bank of England cut rates twice in eight days (on 11 and 18 March) and announced measures to help ease fears of a credit crunch.
Between 18 March and 23 July, the long-term gilt and AA rated corporate yields have fallen by 68 and 160 basis points respectively (see Figure 2). In the year to date, they are down by 69 and 62 basis points respectively. This is a material reduction in discount rates, fuelling material increases in DB liabilities.
Figure 2: Yield (%) on UK gilts and AA rated corporate bonds year to date
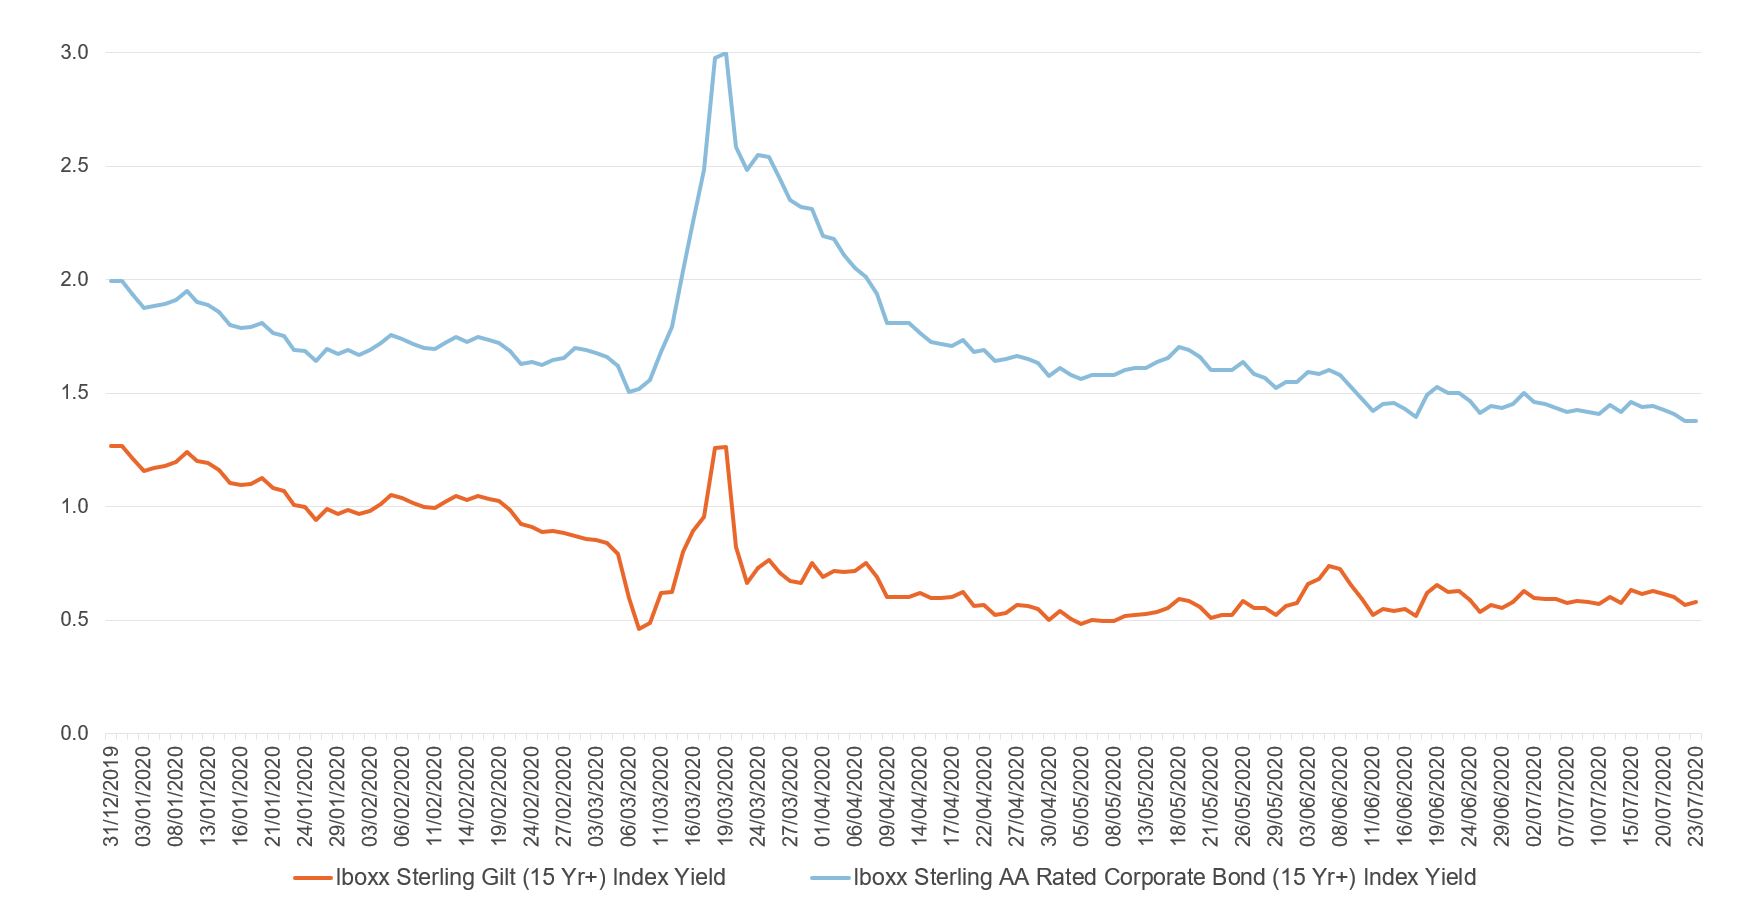
Source: Datastream
DB scheme sponsors are exposed to inflation risk because employee salaries are inflation-linked. The projected economic malaise linked to the Covid-19 pandemic caused market-implied inflation levels (based on 20-year spot rates) to fall from 3.36% at the beginning of the year to 2.82% by 20 March. While this caused a decrease in projected liabilities, much of the effect was short lived.
From late March until now, substantial increases in broad money by central banks have fuelled inflationary fears. As at the end of June, market-implied inflation levels had risen to 3.23%, adding once more to projected DB liabilities (see Figure 3).
Figure 3: Market-implied inflation (%) year to date
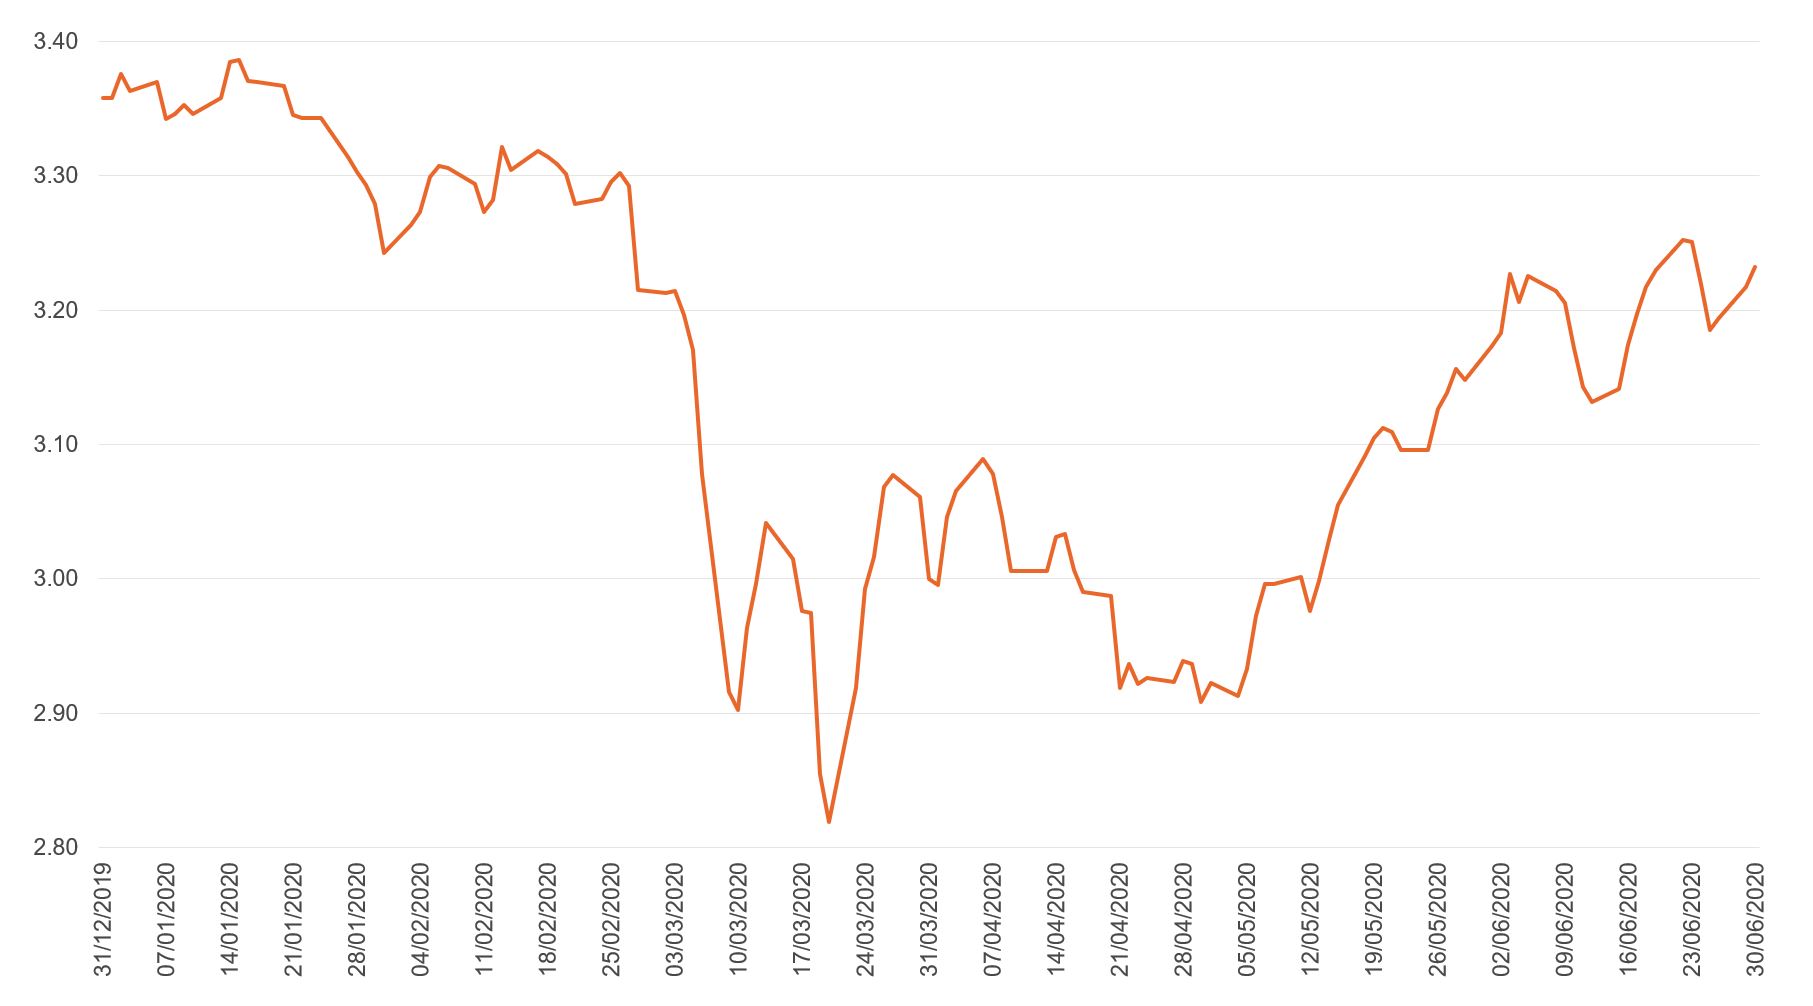
Source: Datastream
Covid-19 and DB scheme valuations
Figure 4: Aggregate pension deficit and funding level of FTSE 350
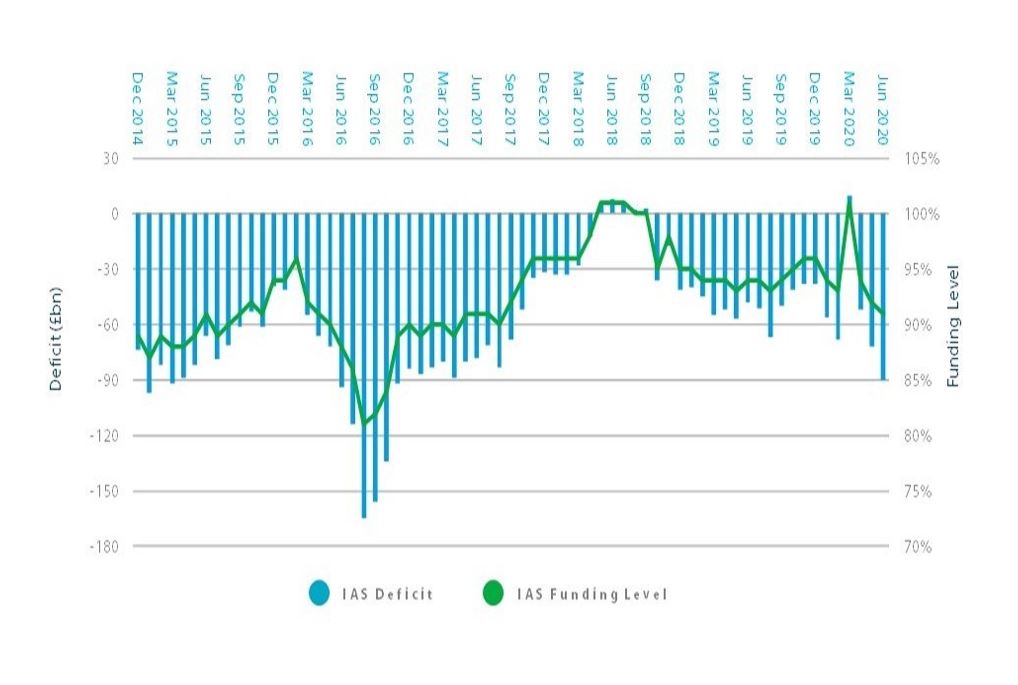
Source: Mercer
In the past five years, DB pension deficits have fluctuated considerably, driven to a considerable degree by uncertainty in the lead-up to and aftermath of the 2016 Brexit referendum. At its nadir in July 2016, the aggregate deficit across FTSE 350 schemes was around £160 billion corresponding to a funding level of around 82% (see Figure 4).
The relatively benign market environment since then resulted in an improvement in funding positions, culminating in a projected aggregate DB surplus for the FTSE 350 as of end March 2020.
Since then, with the UK in lockdown for the majority of the period, estimated funding levels have plummeted owing to a combination of market volatility, falling discount rates and rising inflationary expectations. On aggregate, it is projected that that the current deficit of FTSE 350 DB schemes is in the region of £90 billion, corresponding to a funding level of 92%.
How does funding deterioration affect sponsors and members of occupational schemes?
Rapid reversals in DB funding levels have occurred several times over the past two decades: first, in the aftermath of the ‘dotcom’ collapse in the early 2000s; and second, in the fallout from the 2007/08 global financial crisis. The Covid-19 pandemic promises similar funding malaise. It is likely that this will intensify pre-existing trends in occupational pension provision.
Impact on sponsor leverage and credit status
Pension deficits materially increase corporate leverage (Bartram, 2016). They appear on corporate balance sheets and unlike traditional leverage, they are volatile. As such, the cash contributions required to service deficits can also be volatile.
Extant research asserts that bond and credit derivatives markets price this heightened risk in the form of higher credit spreads (Cardinale, 2007) and credit default swap premia (Gallagher and McKillop, 2010). Increased pension deficits are also associated with lower credit ratings (International Monetary Fund, IMF, 2004). Taken in aggregate, sponsors of poorly funded schemes face higher debt servicing costs.
Regulatory consequences and their corporate financial spillovers
Funding deterioration weakens the sponsor covenant and can draw regulatory ire. Poorly funded schemes are required to put in place deficit recovery plans with the Pensions Regulator. These require higher levels of contribution and, in extremis, mandatory cash contributions to the plan.
Heightened cash contributions bring corporate financial consequences, some of which are unintended. They can lower corporate investment activity (Rauh, 2006; Franzoni, 2009; Bunn et al, 2018), reduce forward equity returns (Franzoni and Marin, 2006) and disrupt mergers and acquisitions (M&A) activity (Cocco and Volpin, 2013).
When pension distress coincides with distress of the sponsor, managerial risk shifting from the sponsor to the plan is more common (Anantharaman and Lee, 2013). There is mixed evidence on the relationship between deficit reduction initiatives and payout policy (Armitage and Gallagher, 2019; Bunn and Trivedi 2005; Liu and Tonks, 2013).
Risks to the Pension Protection Fund
The Pension Protection Fund (PPF) was established by the Pensions Act (2004) in order to provide a backstop for UK DB schemes. In return for paying an annual levy, the PPF assumes responsibility for the assets and liabilities of the schemes of insolvent sponsors.
It has been argued that the PPF is subject to significant systemic risk where increased incidence of corporate default coincides with the pension schemes of the defaulters being at their weakest (McCarthy and Neuberger, 2005; Blake et al, 2007). This raises the spectre of financial instability of the PPF and the question of a government bailout.
The dual impact of the Covid-19 pandemic on corporate default risk and pension scheme funding will present the largest challenge the PPF has faced since its inception.
De-risking initiatives
When funding levels decline, pension sponsors move to ‘de-risk’ their schemes. Concurrent to reducing asset risk in the portfolio, sponsors contain liabilities by freezing benefit accrual for some or all scheme members. This is often the precursor to formally winding the scheme up.
By 2019 year-end, just 11% of UK DB schemes remained fully open, down from 43% in 2006. More recently, schemes have engaged with financial counterparties to hedge pension risk explicitly (Sutcliffe, 2016). The most common transactions are pension buy-ins and buy-outs where an insurer guarantees a portion or all scheme benefits in return for a transaction premium.
Schemes also hedge longevity risk via longevity swaps, a product that not widely used prior to 2009. The growing trend for firms to hedge pension risk with counterparty transactions is projected to continue (Lane, Clark and Peacock, 2020).
Figure 5: UK DB scheme status by year
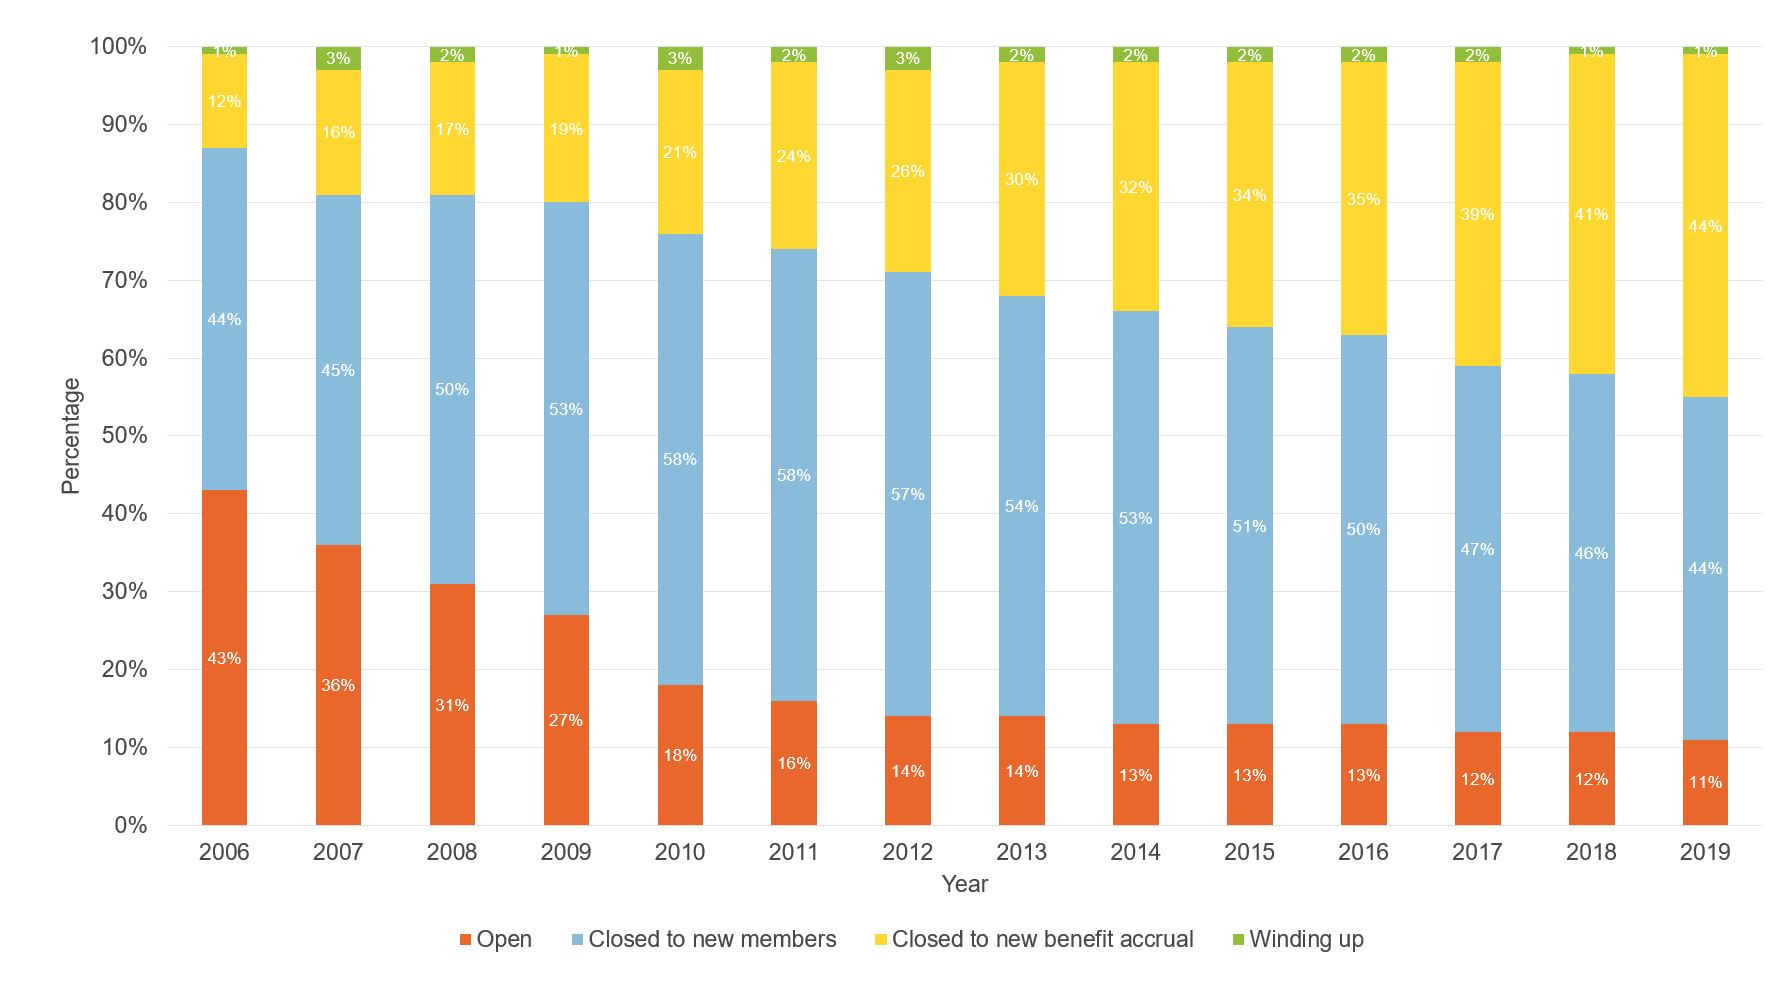
Source: The Pension Protection Fund Purple Book 2019
Migration from DB to DC schemes
With DB scheme curtailment widespread, many sponsors have replaced their DB plans with DC alternatives (see Figure 5). These generally have lower member benefits, less generous contributions from employers and put more responsibility for investment choice in the hands of scheme members.
This is likely to manifest in sub-optimal decision-making – for example, naive diversification (Benartzi and Thaler, 2001), over-confidence (Barber and Odean, 2002), familiarity bias (Benartzi. 2001; French and Poterba, 1991) and performance chasing (Bailey et al, 2011).
Additionally, the monetary policy response to the Covid-19 crisis has caused significantly higher annuity prices. A given accumulated pension pot buys considerably less retirement income than in a higher rate environment. This can crystallise the impact of the market turmoil for those taking the ‘once in a lifetime’ annuity purchase decision.
Faced with lower investment accumulation and more expensive annuities, it is likely that the switch to DC pensions will lead to much lower incomes for UK pensioners in future.
What else do we need to know?
The true scale of the economic impact of the Covid-19 pandemic is unclear. The monetary and fiscal stimuli injected by central banks and treasuries have steadied markets and curtailed unemployment – for now. As these measures are relaxed, and the true impact of the pandemic on the earning power of global firms becomes apparent, markets and scheme funding positions may weaken further.
The economic outlook is also highly contingent on maintaining the delicate balance between economic re-opening and virus suppression. Markets also eagerly await news of the development of a vaccine.
Where can I find out more?
- Raiding the pot: pandemic deepens pensions crisis: Josephine Cumbo, Robin Wigglesworth and Billy Nauman describe the impact that market turmoil and falling discount rates are having on global pension savings.
- Suspended UK pension contributions could total £1 billion: Josephine Cumbo suggests that many firms may strike deals with pension scheme trustees to suspend pension contributions in order to stay afloat during the Covid-19 crisis.
- The implications of the COVID-19 pandemic for pensions: Charles Sutcliffe identifies two groups most significantly affected by the pandemic – those who transfer their pension or withdraw cash from their pension while asset prices are depressed; and members of defined benefit schemes with a deficit whose employer fails.
- Building better retirement systems in the wake of the global pandemic: Olivia Mitchell suggests that widespread reform is needed to ensure that scheme members are equipped to make better decisions about their occupational pensions, and that schemes are designed with the flexibility to withstand financial distress.
Who are UK experts on this question?
- Seth Armitage
- David Blake
- Philip Bunn
- Ronan Gallagher
- Vicky Kiosse
- Weixi Liu
- Paul Mizen
- Ian Tonks


